
EV Ownership Costs Now Vary by Thousands of Dollars Depending on State, Climate and Charging Access
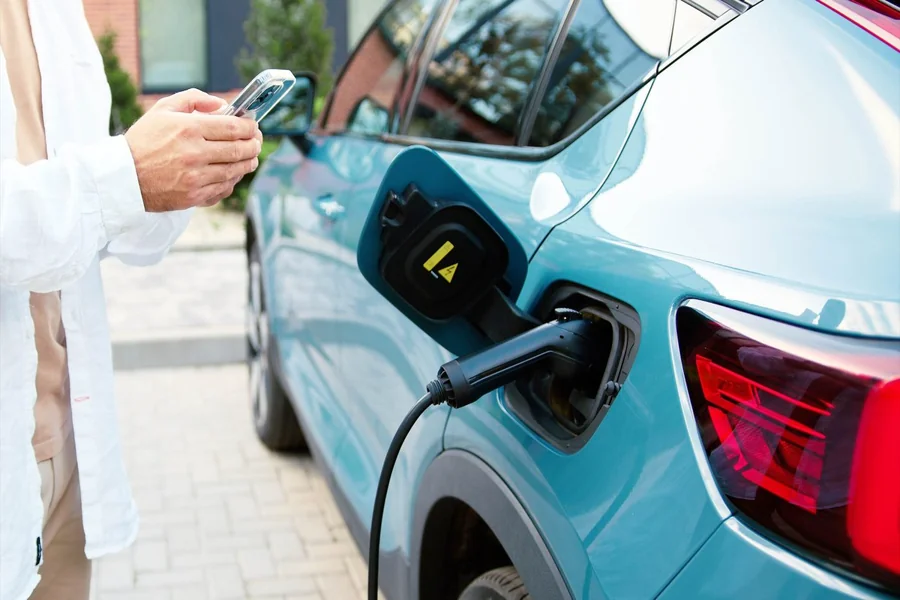
Electric vehicles are no longer supported by the federal purchase incentives that helped close the price gap with gasoline-powered cars, but rising fuel costs and lower maintenance expenses continue to make them financially attractive for some drivers.
A study by Attorney Brian White found that the cost of EV ownership now depends heavily on five factors: depreciation, charging method, local electricity prices, weather and state taxes or incentives.
An EV owner who charges at home in a state with high gasoline prices may save substantially over time. A driver who depends on public fast chargers, lives in a cold region and pays a large annual registration fee may see little or no savings.
The federal $7,500 new-EV credit and $4,000 used-EV credit ended in September 2025. Their removal came as EV prices were briefly reaching parity with gasoline vehicles and gas prices were climbing toward levels not seen since 2022.
The EV Ownership Equation
| Cost Factor | EV Advantage or Disadvantage |
|---|---|
| Routine maintenance | EV advantage |
| Home energy cost | EV advantage |
| Public fast charging | Potential disadvantage |
| Five-year depreciation | EV disadvantage |
| Collision repairs | EV disadvantage |
| Cold-weather range | EV disadvantage |
| Battery warranty | EV advantage |
| State incentive | Depends on location |
| Annual registration fee | Usually disadvantage |
No single figure determines whether an EV is less expensive.
EV Depreciation Can Reach 60%
Across the entire vehicle market, five-year depreciation averages 45% to 46%.
Gas-powered vehicles typically lose 40% to 50% of their original value, while EVs commonly lose 55% to 60%.
| Vehicle Category | Average Five-Year Value Loss |
|---|---|
| All vehicles | 45% to 46% |
| Gas vehicles | 40% to 50% |
| EVs | 55% to 60% |
| Strongest-retaining EVs | 30% to 40% |
| Weakest-retaining EVs | 65% to 70% |
For a $50,000 vehicle:
- A 45% depreciation rate equals $22,500.
- A 60% depreciation rate equals $30,000.
- The difference is $7,500.
That difference is equal to the former federal new-EV credit.
The comparison illustrates how depreciation can outweigh several years of fuel and maintenance savings.
Maintenance Savings Can Reach $1,650 Per Year
Routine EV maintenance remains significantly cheaper.
| Vehicle Type | Annual Routine Maintenance |
|---|---|
| Electric vehicle | $150 to $300 |
| Gas-powered vehicle | $900 to $1,800 |
Potential annual savings range from $600 to $1,650.
Over eight years, the difference could reach:
- $4,800 at the lower end
- $13,200 at the upper end
EVs require fewer routine services because they have no engine oil, exhaust system or conventional transmission.
Most also carry battery warranties lasting eight to 10 years or approximately 100,000 miles.
Accident Repairs Cost 20% More
The maintenance advantage does not extend to collision repairs.
Claims data shows EV repairs average 20% more than gasoline-vehicle repairs.
The difference may rise to 30% by 2027.
| Comparable Repair | Gas Vehicle | EV at 20% Premium | EV at 30% Premium |
|---|---|---|---|
| Minor-to-moderate repair | $5,000 | $6,000 | $6,500 |
| Major repair | $10,000 | $12,000 | $13,000 |
| Severe repair | $20,000 | $24,000 | $26,000 |
Battery protection systems and large structural components can make repair decisions more complicated. Damage that would be repairable on a gas vehicle may result in a more expensive replacement procedure on an EV.
Home Charging and Public Charging Produce Opposite Results
Charging location is one of the strongest predictors of cost efficiency.
Most potential buyers plan to charge at home. Surveys found that 79% expect home charging to be their primary source of energy.
At 20°F, home-charged EVs remain cheaper than hybrids, while publicly charged EVs become substantially more expensive.
| Cold-Weather Comparison | Cost Difference per 1,000 Miles |
|---|---|
| EV home charging versus hybrid | $36.19 cheaper |
| EV public charging versus hybrid | $86.26 more expensive |
At 95°F:
| Hot-Weather Comparison | Cost Difference per 1,000 Miles |
|---|---|
| EV home charging versus hybrid | $46.11 cheaper |
| EV public charging versus hybrid | $41 more expensive |
Over 12,000 miles, the annual difference could become substantial.
Cold-weather annualized estimate
- Home charging advantage: approximately $434
- Public charging disadvantage: approximately $1,035
Hot-weather annualized estimate
- Home charging advantage: approximately $553
- Public charging disadvantage: approximately $492
The figures demonstrate why the same vehicle may be economical for a homeowner with a garage and costly for a renter dependent on public infrastructure.
Extreme Cold Cuts Range by Nearly Two-Fifths
At 20°F, EV range can decline 39%.
| Weather Condition | EV Efficiency Loss | EV Range Loss |
|---|---|---|
| 95°F | 10.4% | 8.5% |
| 20°F | 35.6% | 39% |
A vehicle rated at 250 miles could fall to approximately 153 miles in extreme cold.
A 350-mile model could fall to approximately 214 miles.
Cold batteries also accept power more slowly, extending charging times.
Drivers in cold climates may therefore face:
- More frequent charging
- Longer charging sessions
- Additional route planning
- Higher public charging costs
- Greater range uncertainty
Fast-Charging Access Remains Uneven
A Bay Area accessibility study found that drivers had only 5.2 hours of feasible daily access to fast chargers.
That result came from a region with relatively high charger density, suggesting access may be even more limited elsewhere.
Most EV drivers are willing to wait 21 to 40 minutes for a fast charge. A gasoline fill-up generally takes only a few minutes.
The time difference becomes more significant during long trips.
For three charging stops, a driver could spend:
- 63 minutes at 21 minutes per stop
- 120 minutes at 40 minutes per stop
That does not include time spent waiting for an available charger.
Charger Counts Vary by More Than 28,000
California and New York dominate the national charging network.
| State | Charging Stations |
|---|---|
| California | 28,393 |
| New York | 21,380 |
| Florida | 8,231 |
| Massachusetts | 6,492 |
| Texas | 6,173 |
The least-served states had fewer than 110 stations.
| State | Charging Stations |
|---|---|
| Wyoming | 43 |
| Alaska | 65 |
| North Dakota | 85 |
| South Dakota | 85 |
| Montana | 105 |
California had 28,350 more stations than Wyoming.
New York had more than three times Florida’s total.
The gap affects both convenience and travel planning. Drivers in sparsely served states may need to select routes based on charging access rather than distance.
Public Charging Costs Vary by 82%
West Virginia recorded the highest public charging price at $0.529 per kilowatt-hour.
Kansas recorded the lowest at $0.291.
| Highest-Cost State | Price per kWh |
|---|---|
| West Virginia | $0.529 |
| Hawaii | $0.512 |
| Alaska | $0.472 |
| Louisiana | $0.467 |
| New Hampshire | $0.464 |
| Lowest-Cost State | Price per kWh |
| Kansas | $0.291 |
| Missouri | $0.320 |
| Maryland | $0.336 |
| Utah | $0.337 |
| Iowa | $0.340 |
A 75-kWh charging session would cost:
- $39.68 in West Virginia
- $21.83 in Kansas
The difference is $17.85 per charge.
Across 30 charging sessions, the difference would reach $535.50.
High Gas Prices Make EVs More Competitive
The national gasoline average reached $4.50 per gallon in May 2026.
That represented a 43.6% increase from the previous year.
| Month | National Gas Price |
|---|---|
| February 2026 | $2.91 |
| March 2026 | $3.64 |
| April 2026 | $4.10 |
| May 12, 2026 | $4.50 |
| May 28, 2026 | $4.43 |
California reached $6.15 per gallon, followed by Washington at $5.77 and Hawaii at $5.64.
A gasoline vehicle achieving 25 miles per gallon would require 480 gallons to travel 12,000 miles.
At $4.50 per gallon, annual fuel cost would reach $2,160.
At California’s $6.15, the cost would reach $2,952.
Those figures make home-charged EVs considerably more competitive, particularly in high-price states.
EV Buyers Face a Patchwork of State Rules
Seventeen states continue to offer incentives.
The available amounts range from $1,500 to $7,500.
Forty states impose additional registration fees on EVs or hybrids.
| State Fee Example | Annual EV Fee |
|---|---|
| Hawaii | $50 |
| South Dakota | $50 |
| New Jersey | $260 |
| Georgia | $234.97 |
| Indiana | $230 |
| North Carolina | $214.50 |
| Alabama | $203 |
| Tennessee | $200 |
| Arkansas | $200 |
Some states have made major changes since 2023.
- California and Alaska ended EV credit programs.
- New Mexico introduced a credit.
- Texas, New Jersey and several other states added fees.
- Tennessee doubled its fee.
- Kansas increased its fee by more than 135%.
- Nebraska doubled its fee.
For drivers, these annual charges reduce operating savings.
A $260 fee over eight years totals $2,080 before future increases.
Mileage Programs May Replace Flat Fees
Several states now allow mileage-based road charges.
| State | Charge per Mile |
|---|---|
| Oregon | $0.0200 |
| Virginia | $0.0114 |
| Utah | $0.0111 |
| Hawaii | $0.0080 |
At 15,000 miles per year:
- Oregon: $300
- Virginia: $171
- Utah: $166.50
- Hawaii: $120
These programs may benefit low-mileage drivers but cost more for commuters who drive long distances.
Workplace Charging Could Be the Next Major Incentive
Only 15% of employees currently receive zero-emission transportation benefits.
Interest is substantially higher:
| Workplace EV Benefit | Employee Interest |
|---|---|
| Workplace charging | 98% |
| EV purchase or lease subsidy | 91% |
Free workplace charging can reduce or eliminate commuting energy costs.
It can also make EV ownership more practical for:
- Apartment residents
- Long-distance commuters
- Drivers without garages
- Households unable to install chargers
- Employees in high-cost electricity markets
Large employers increasingly use charging access as a recruitment and retention tool.
The study by Attorney Brian White shows that the financial question is no longer simply whether EVs cost less than gas cars. It is whether a specific driver has access to the conditions that produce savings. Those conditions include home or workplace charging, moderate weather, affordable electricity, manageable fees and a vehicle that retains its value.