
America’s Pothole Crisis Is Costing Drivers Up to $1,100 a Year
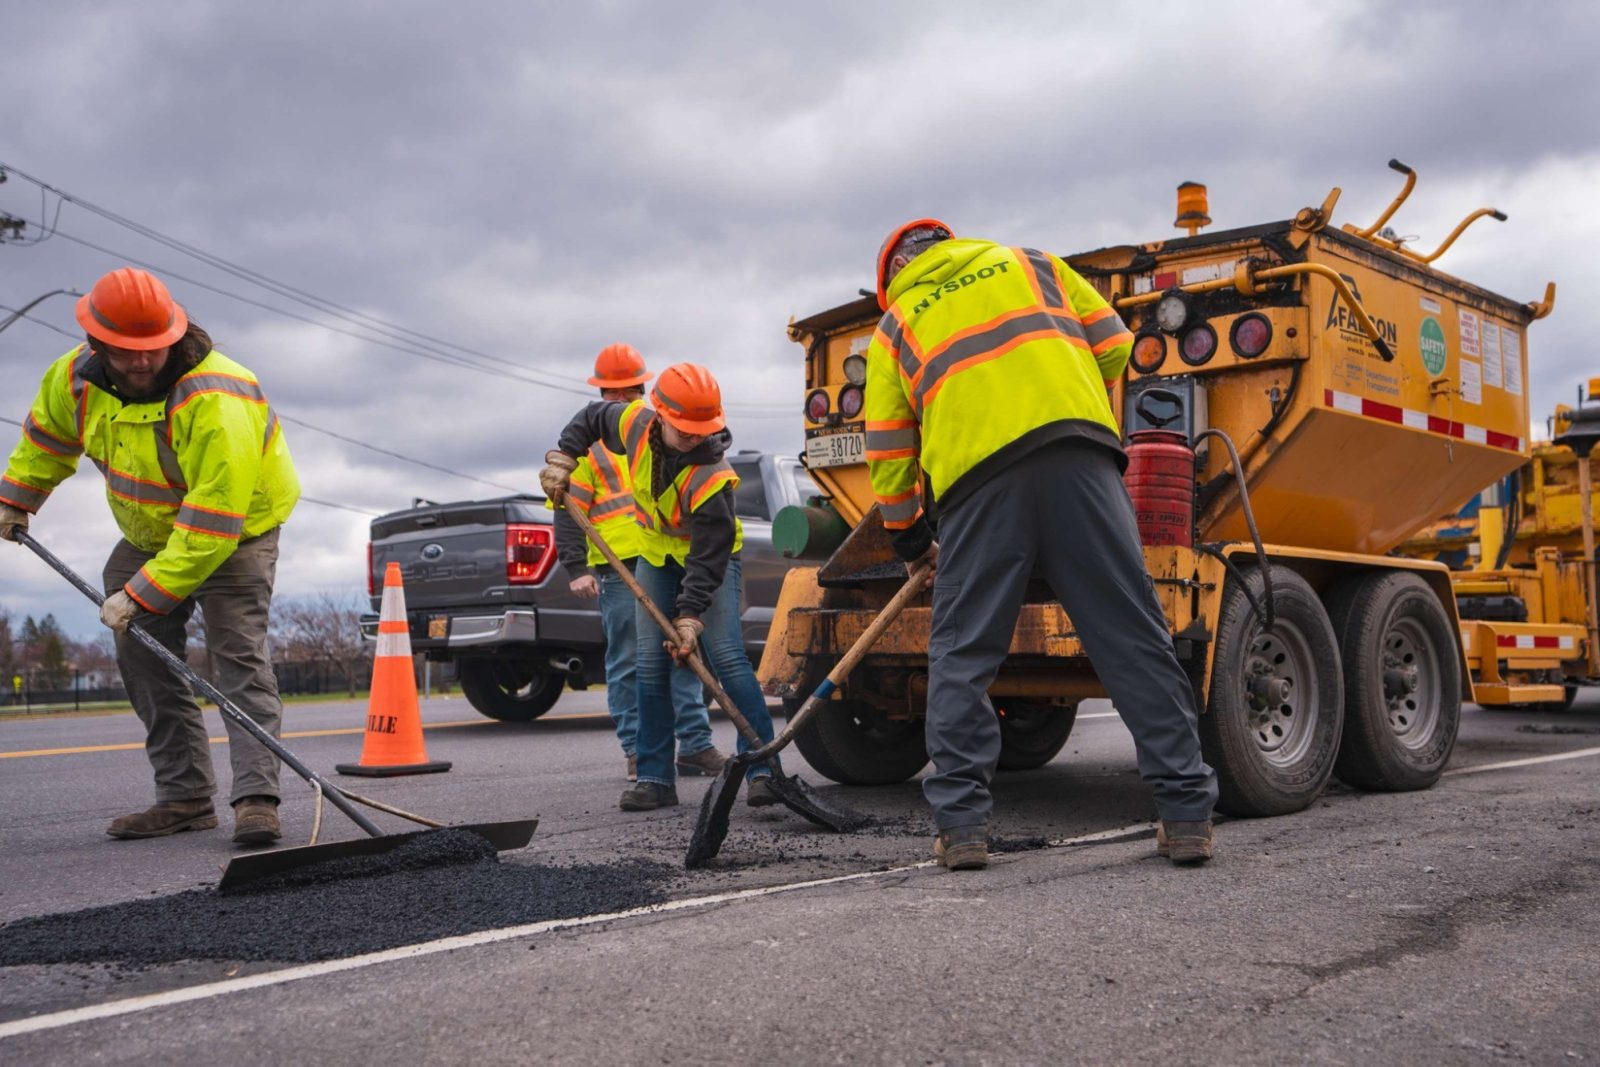
The cost of driving on deteriorated roads depends heavily on where a motorist lives.
A national study by CR Legal Team found that poor road conditions cost the average driver approximately $571 annually, but motorists in Washington, D.C., face an estimated burden of $1,100 per year. Rhode Island drivers pay about $845, while drivers in Tennessee face a comparatively low annual cost of $209.
The gap reflects a broader national infrastructure problem. Nearly 40% of major U.S. roads are in poor or mediocre condition, and approximately 174,740 miles of highway are classified as poor. Across nearly 4 million miles of road, the country may have more than 55 million potholes.
The financial consequences include tire replacements, wheel repairs, suspension damage, steering problems, increased fuel use and lost time in traffic. National pothole-related repair expenses are estimated at $26.5 billion per year.
America’s Pothole Problem in Numbers
| Measure | Finding |
| Estimated potholes nationwide | 55 million |
| Approximate potholes per road mile | 13 |
| Highway miles in poor condition | 174,740 |
| Major roads rated poor or mediocre | Nearly 40% |
| Annual pothole repair cost to drivers | $26.5 billion |
| Drivers paying for repairs in 2022 | 44 million |
| Average repair per incident | $406 to $600 |
| Average annual poor-road cost per driver | $571 |
| Highest annual cost | $1,100 in Washington, D.C. |
| Estimated road funding gap | $684 billion |
The numbers show that the pothole problem operates at both a household and government level. Drivers pay for vehicle damage, while taxpayers fund public repair programs that remain insufficient to close the long-term infrastructure gap.
Pothole Repair Costs Rose Sharply
Approximately 44 million drivers paid for pothole-related vehicle damage in 2022. The previous year, the total was 28 million.
That means the number of affected drivers increased by 16 million in one year.
| Year | Drivers Paying for Pothole Repairs |
| Previous year | 28 million |
| 2022 | 44 million |
| Increase | 16 million |
A separate AAA survey reported a 57% increase in drivers experiencing repair-worthy pothole damage.
The average incident costs between $406 and $600, but repair bills can exceed $1,000 when a vehicle suffers multiple forms of damage.
In one April 2026 incident on Interstate 40 near Nashville, a single pothole reportedly damaged more than 20 vehicles within several hours. Some drivers faced repair bills approaching $1,000 for tires, wheels and suspension components.
Common Pothole Damage
A hard pothole impact may affect several vehicle systems at once.
Common damage includes:
- Blown or punctured tires
- Bent rims
- Cracked wheels
- Suspension damage
- Steering misalignment
- Undercarriage damage
- Wheel alignment problems
AAA recorded 1.8 million roadside assistance calls involving damaged tires during one winter and spring period. Tire damage represented approximately 11% of all roadside assistance calls.
Potholes may become especially expensive for drivers who experience repeated incidents. Some motorists report pothole damage as many as three times within a five-year period.
The Northeast Faces Higher Damage Rates
Pothole damage is approximately 60% more common in the Northeast than in the South and West.
The primary reason is climate. Water enters pavement cracks, freezes and expands, then melts and leaves empty space beneath the roadway surface. Repeated freeze-thaw cycles weaken pavement until traffic causes the upper layer to collapse.
Public concern reflects that regional difference:
- 64% of U.S. drivers say they are concerned about potholes.
- Concern rises to 74% among drivers in the Northeast.
- Tire repair rates are significantly higher in the Northeast than in warmer regions.
Heavy rain and sharp temperature changes can accelerate the process even outside traditional cold-weather areas.
Poor Roads Cost Drivers More Than Repairs
The annual cost of poor roads includes more than direct repair expenses.
Drivers also pay through:
- Reduced fuel efficiency
- Greater tire wear
- Faster suspension deterioration
- Extra time in traffic
- Repair-related travel delays
- Higher maintenance frequency
The national average annual cost is estimated at $571 per driver.
Highest and lowest annual costs
| Area | Annual Cost per Driver |
| Washington, D.C. | $1,100 |
| Rhode Island | $845 |
| National average | $571 |
| Wyoming | $295 |
| Oregon | $256 |
| Tennessee | $209 |
A Washington, D.C., driver pays approximately $891 more per year than a Tennessee driver.
Over five years, that difference would total about $4,455, excluding inflation or additional major repairs.
States With the Fastest Road Deterioration
Road quality worsened significantly in several states between 2019 and 2024.
| Rank | State | Increase in Poor Roads |
| 1 | Idaho | 68.6% |
| 2 | Oklahoma | 29.9% |
| 3 | California | 28.6% |
| 4 | New Mexico | 25.5% |
| 5 | Oregon | 25.0% |
| 6 | Virginia | 25.0% |
| 7 | Arizona | 25.0% |
| 8 | Louisiana | 18.4% |
| 9 | Florida | 14.3% |
| 10 | Mississippi | 14.0% |
| 11 | Colorado | 13.7% |
| 12 | Washington | 13.3% |
Idaho’s increase was more than twice as large as any other state in the ranking.
California, Oklahoma and New Mexico also experienced substantial deterioration, while Minnesota, Indiana and South Dakota recorded notable improvements.
Texas Has the Most Highway Miles Needing Repair
Texas had approximately 19,400 miles of highway in poor condition, the largest state total cited in the research.
That scale has made Texas the largest recipient of federal highway aid.
| Measure | Texas |
| Highway miles needing repair | 19,400 |
| Federal highway aid | $26.9 billion |
| Average federal aid per state | $5.4 billion |
Texas received nearly five times the average state allocation.
Other cities also spend heavily on routine pothole repair. Oklahoma City fills as many as 90,000 potholes each year. San Diego spent approximately $1.3 million repairing more than 30,000 potholes in one year.
Tacoma, Washington, launched a program aimed at repairing or preventing approximately 9,000 potholes.
Swerving Can Be More Dangerous Than the Pothole
Pothole crashes are not limited to direct impacts.
Drivers often swerve to avoid a damaged section of pavement, creating the risk of lane departures, sideswipe collisions, rollovers and roadway departures.
Road debris and related evasive maneuvers contribute to an estimated:
- 53,000 crashes annually
- 5,500 injuries
- 72 deaths
Aggressive driving is involved in 54% of fatal crashes, while sudden lane changes and steering corrections are among the most dangerous driving behaviors.
Approximately 40% of fatal rollover crashes involve excessive speed. Sudden steering becomes especially dangerous on roads with speed limits of 55 mph or higher.
Potholes May Contribute to Road Rage
Repeated exposure to damaged roads can increase driver frustration.
Reported aggressive behaviors include:
- Tailgating
- Cutting off other drivers
- Sudden lane changes
- Excessive horn use
- Road rage incidents
Recent driver behavior data indicates:
| Measure | Finding |
| Drivers admitting aggressive behavior | 92% |
| Increase in cutting off other vehicles since 2016 | 67% |
| Increase in angry honking | 47% |
| Increase in aggressive driving incidents, 2015 to 2024 | 30% |
| Fatal road rage shooting deaths in a recent year | 141 |
Louisiana ranked highest for road rage, followed by New Mexico and Montana.
Electric Vehicles May Be More Vulnerable
Electric vehicles face additional pothole exposure because of weight and tire design.
An EV typically weighs 20% to 30% more than a comparable gasoline vehicle. Long-range batteries may weigh 1,000 to 2,000 pounds.
That weight increases impact force during a pothole strike.
EV-related findings include:
- EVs experience roughly twice as much tire trouble as combustion vehicles.
- EV tires may wear 15% to 30% faster.
- Some manufacturers estimate average tire wear 20% faster.
- Low-profile tires increase the risk of wheel and sidewall damage.
As EV adoption expands, road quality may become a growing maintenance issue for owners already paying higher tire replacement costs.
Rural Roads Present a Separate Safety Problem
Only 19% of Americans live in rural areas, but 47% of roadway fatalities occur there.
That disparity reflects several factors:
- Higher travel speeds
- Longer emergency response times
- Older road infrastructure
- Limited lighting
- Narrow shoulders
- Greater distances between repair crews
The figures show that deteriorating roads are not only an urban congestion issue. Rural motorists may face fewer vehicles but more severe crash outcomes.
Federal Spending Still Falls Short
Federal infrastructure programs have directed hundreds of billions of dollars toward transportation.
- More than $591 billion has been allocated through infrastructure programs since late 2021.
- Approximately $454 billion was directed to transportation projects between 2022 and 2026.
- The remaining roadway funding gap is estimated at $684 billion over the next decade.
Only Maryland and New Jersey collect enough through fuel taxes, tolls and vehicle fees to cover highway spending. Most states rely on general tax revenue to make up maintenance shortfalls.
The CR Legal Team study shows that potholes function as a hidden road tax. Drivers contribute through fuel taxes and registration fees, then pay again through repair bills, higher fuel consumption and lost time. With tens of millions of potholes nationwide and a funding gap larger than current federal commitments, the financial burden is likely to remain a recurring part of American driving.