
Summer Traffic Deaths Have Risen as Record Travel and Impaired Driving Collide
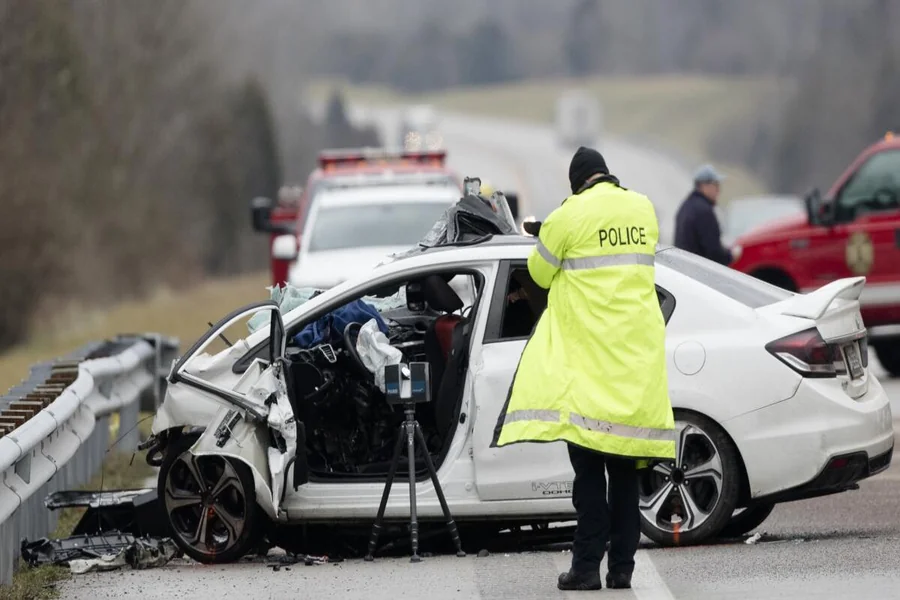
The Fourth of July has become one of the most dangerous dates on the American road calendar, and the nation’s 250th anniversary is expected to bring even greater travel and public safety pressure.
A study by The Millar Law Firm found that fatal DUI crashes on Independence Day increased at an average annual rate of 6.3% between 2014 and 2023. That growth was substantially higher than the increases recorded during Memorial Day and Labor Day.
The analysis also found that 1,407 people died in July 4 crashes from 2015 through 2024, while the broader holiday periods from 2020 through 2024 produced 2,719 deaths. Drunk drivers were involved in 38% of those holiday-period fatalities.
Independence Day Risk by the Numbers
| Measure | Finding |
|---|---|
| Fatal DUI crash annual growth, 2014 to 2023 | 6.3% |
| July 4 deaths, 2015 to 2024 | 1,407 |
| Fatal crashes on July 4 | 1,279 |
| Holiday-period deaths, 2020 to 2024 | 2,719 |
| Share involving drunk drivers | 38% |
| 2024 holiday-period traffic deaths | 579 |
| 2025 projected travelers | 72.2 million |
| 2025 projected drivers | 61.6 million |
| July 4 increase in speeding | 46% |
| July 4 increase in distraction | 11.9% |
DUI Fatalities Are Rising Faster on July 4
Independence Day’s 6.3% annual growth rate in fatal DUI crashes was much higher than other major summer holidays.
| Holiday | Annual Increase |
|---|---|
| Independence Day | 6.3% |
| Memorial Day | 1.6% |
| Labor Day | 1.0% |
The July 4 growth rate was 4.7 percentage points higher than Memorial Day and 5.3 points higher than Labor Day.
Independence Day also had a DUI fatality rate 46% above average, ranking behind only Labor Day and New Year’s Day.
The holiday week produced 1,229 DUI-related fatalities from 2018 through 2022. Only Labor Day week recorded more, with 1,278.
Weekend Timing Magnifies Holiday Risk
Alcohol-related crash deaths are concentrated during weekends.
- 57% of alcohol-related traffic deaths occur on weekends.
- Saturday accounts for more than 22% of DUI-related crashes.
- Sunday accounts for approximately 20%.
- Saturday BAC averages range from 0.075% to 0.082%.
A July 4 weekend creates a longer period of gatherings, travel and drinking. Evening fireworks also lead to a sudden wave of vehicles leaving venues at the same time.
The decade of July 4 crash data shows how totals can vary with the calendar.
| Year | Fatal Crashes | Deaths |
|---|---|---|
| 2015 | 129 | 145 |
| 2016 | 108 | 116 |
| 2017 | 121 | 137 |
| 2018 | 121 | 140 |
| 2019 | 100 | 108 |
| 2020 | 158 | 167 |
| 2021 | 160 | 173 |
| 2022 | 123 | 129 |
| 2023 | 131 | 148 |
| 2024 | 128 | 144 |
The lowest death total was 108 in 2019. The highest was 173 in 2021, a difference of 65 deaths.
The total increased 60% between those two years.
July 4 Travel Has Reached Record Levels
A record 72.2 million Americans were projected to travel at least 50 miles during the 2025 Independence Day period.
That was:
- 1.7 million more than in 2024
- Approximately 7 million more than in 2019
- The highest July 4 travel projection on record
More than 61.6 million people were expected to travel by car.
| Travel Mode | Projected Travelers |
|---|---|
| Automobile | 61.6 million |
| Total travelers | 72.2 million |
| Automobile share | Approximately 85% |
The National Safety Council projected 437 traffic deaths during the 2025 holiday period. The previous comparable 3.25-day window occurred in 2022 and produced 464.
The 2026 anniversary will be supported by five days of official national events from July 1 through July 5, increasing the potential for high traffic volume throughout the holiday period.
Smaller States Recorded Some of the Highest Death Rates
Population-adjusted rankings produced a different picture than raw fatality totals.
Montana and South Dakota recorded the highest rates at 0.97 deaths per 100,000 residents.
| Rank | State | Deaths | Rate per 100,000 |
|---|---|---|---|
| 1 | Montana | 11 | 0.97 |
| 2 | South Dakota | 9 | 0.97 |
| 3 | New Mexico | 18 | 0.85 |
| 4 | South Carolina | 44 | 0.80 |
| 5 | Oklahoma | 29 | 0.71 |
| 6 | Idaho | 14 | 0.70 |
| 7 | Mississippi | 20 | 0.68 |
| 8 | Missouri | 42 | 0.67 |
| 9 | Louisiana | 29 | 0.63 |
| 10 | West Virginia | 11 | 0.62 |
Wyoming recorded the lowest rate at 0.17.
| State or District | Rate per 100,000 |
|---|---|
| Wyoming | 0.17 |
| New York | 0.18 |
| Massachusetts | 0.18 |
| Iowa | 0.19 |
| New Jersey | 0.22 |
| Maryland | 0.22 |
| Utah | 0.23 |
| Minnesota | 0.26 |
| Hawaii | 0.28 |
| District of Columbia | 0.29 |
Montana’s rate was approximately 471% higher than Wyoming’s.
The rankings demonstrate that raw totals alone do not define risk. New York recorded 36 deaths but had one of the lowest population-adjusted rates. Montana recorded 11 deaths but tied for the highest rate.
Alcohol Is Only Part of the July 4 Traffic Problem
Speeding and distraction also rise.
Drivers speed 46% more on July 4 than on comparable dates. Speeding can begin as early as 7 a.m. and increase later in the morning.
Distracted driving rises 11.9%. Drivers spend an average of 2 minutes and 23 seconds distracted during each hour behind the wheel.
Distraction also increases around the holiday:
- July 3: 4% increase
- July 4: 11.9% increase
- July 5: 4.5% increase
The combination of impaired driving, speeding and distraction creates risks for vehicle occupants and pedestrians.
Summer Drinking Starts Earlier in the Day
July 4 alcohol risks are not limited to nighttime travel.
People are 19% more likely to drink in July, and almost 47% of summer days have an average BAC above 0.06%.
| Month | Average BAC |
|---|---|
| June | 0.066% |
| July | 0.063% |
| August | 0.063% |
Five summer days exceed an average BAC of 0.08%:
- June 7
- June 14
- June 21
- July 3
- July 4
A BAC of 0.02% can impair multitasking, while a 0.08% level represents the legal driving limit in most jurisdictions.
In 2024, 11,904 people died in alcohol-impaired driving crashes. Another 2,028 died in crashes involving drivers with BAC levels below 0.08% but above zero.
The Holiday Sends Tens of Thousands to Emergency Departments
More than 45,000 people visit emergency departments during July 4 and July 5.
Fireworks account for thousands of those cases.
| Fireworks Measure | 2023 Total |
|---|---|
| Estimated emergency department visits | 9,700 |
| Injuries near Independence Day | 6,400 |
| Deaths | At least 8 |
Children under 15 accounted for approximately 31% of fireworks injuries. Adults ages 25 to 44 represented another 31%.
Other common holiday injuries include:
- Falls
- Burns
- Broken bones
- Head trauma
- Pool accidents
- Boating injuries
- Food poisoning
- Pedestrian crashes
Heat Adds Another Layer of Risk
July recorded 478 heat-related deaths in 2024.
That was nearly double the August total and almost seven times the May total.
| Month | Heat Deaths |
|---|---|
| May | 68 |
| June | 240 |
| July | 478 |
| August | 250 |
| September | 85 |
Alcohol accelerates dehydration and reduces a person’s ability to identify heat exhaustion or heat stroke.
Heat and alcohol can affect judgment during:
- Swimming
- Boating
- Grilling
- Outdoor sports
- Music events
- Beach trips
- Pool parties
Alcohol is involved in 31% of drowning deaths and 18% of fatal boating crashes. A boat operator with a BAC of 0.08% is approximately 14 times more likely to die than a sober operator.
Georgia Recorded Nearly 500 DUI Arrests in One Holiday Period
Georgia authorities made 20,970 traffic stops during the 2025 Independence Day period.
| Georgia Enforcement Measure | Total |
|---|---|
| Traffic stops | 20,970 |
| Citations | 12,000 |
| DUI arrests | 490 |
| Injuries | 135 |
| Traffic deaths | 13 |
Georgia also recorded 62 July 4 deaths from 2015 to 2024.
Only Texas, California and Florida recorded more.
| State | July 4 Deaths |
|---|---|
| Texas | 138 |
| California | 137 |
| Florida | 111 |
| Georgia | 62 |
Georgia’s highest annual total was 11 deaths in 2020. Its lowest was two in 2017.
Boating added further risk in 2025. Georgia recorded 18 boating injuries, 22 boating-under-the-influence citations and two boating deaths.
The Millar Law Firm study shows that July 4 risk is not driven by a single factor. Record travel, weekend drinking, speeding, distraction, fireworks, heat and boating activity all overlap. The 250th anniversary is expected to intensify those conditions across a longer and more heavily attended holiday period.